
April 2026 Real Estate Market Update: West Vancouver & North Shore

April 2026 Real Estate Market Update: West Vancouver & North Shore
The headlines about the broader Metro Vancouver market tell one story. The neighbourhood-level data on the North Shore tells another. This update draws on the March 2026 GVR press release and SnapStats® MLS® transaction data to cut through the noise and give you a clear, honest picture of where things stand.
The Bigger Picture: Metro Vancouver Sets the Stage
March saw 2,032 residential sales across Metro Vancouver, down 2.8 per cent from March 2025 and sitting 31.8 per cent below the 10-year seasonal average of 2,981. That is not a collapse — it is a market that continues to find its footing in an environment shaped by affordability constraints, geopolitical uncertainty, and shifting mortgage rate dynamics.
Total active listings sit at 14,774, up just 1.6 per cent year-over-year but 38 per cent above the 10-year seasonal average. New listings actually fell 10.3 per cent compared to March 2025, suggesting sellers are not flooding the market either. The result is a relatively stable, if subdued, environment.
The region-wide sales-to-active listings ratio sits at 14.2 per cent — technically balanced market territory, though unevenly distributed. Detached homes are at 11 per cent, apartments at 15.7 per cent, and attached at 17.2 per cent. Prices reflect this: the MLS® benchmark for all residential properties is $1,104,300, down 6.8 per cent from a year ago but essentially flat month-over-month.
A Regional Note: The Fraser Valley Context
The inventory story is consistent across Greater Vancouver and the Fraser Valley alike. Fraser Valley active listings have been climbing steadily — Surrey detached listings have more than doubled since 2021, with sales ratios dropping from 57 per cent in 2021 to just 7–8 per cent through early 2026. Langley and Abbotsford tell similar stories.
This region-wide inventory expansion signals that the supply-demand imbalance of the pandemic era has broadly corrected, and in some markets overcorrected. The North Shore, by contrast, remains supply-constrained by geography — which is one reason its price softening has been more moderate than markets further east.
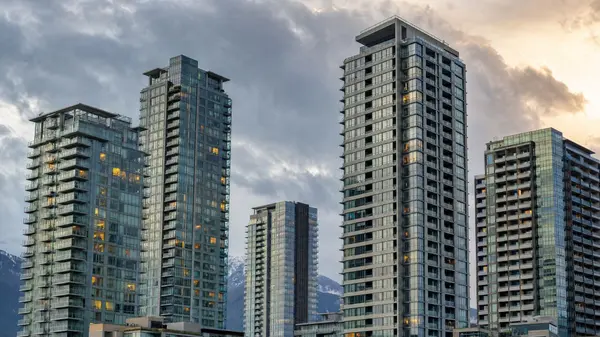
West Vancouver: Stable at the Top
West Vancouver remains one of Canada's most expensive and thinly traded markets, and the data reflects both of those realities.
On the detached side, the 2026 year-to-date sales ratio is running at just 5 per cent — firmly in buyer's market territory. Inventory stands at approximately 394 active listings through the first three months, with only 19 sales recorded on average per month. The median sale price YTD is approximately $3,022,500, with sellers accepting around 92 per cent of list price on average — a meaningful discount relative to the 95–98 per cent ratios seen in stronger years.
West Vancouver Detached — Neighbourhood Snapshot (2025 Full Year)
Price performance varied sharply by location. British Properties recorded a median of $4,019,500 (+9% year-over-year). Altamont reached $6,300,000 (+17%). Meanwhile, Ambleside ($2,402,500, -16%), Dundarave ($2,825,000, -9%), and Chartwell ($3,775,000, -20%) saw meaningful softening. This is not a monolithic market — location, lot size, and product quality are driving outcomes more than broad market forces.
Days on market have been climbing steadily. In 2021, West Van detached homes sold in 23 days on average. By 2025 that had stretched to 38 days, and early 2026 is tracking around 51 days. Still not alarming for this price point, but worth watching closely if you are pricing a listing.
For attached product in West Vancouver, the market is thin. Only 11 sales per month on average YTD 2026, with a median price around $1,356,750 and a sales ratio of just 9 per cent. Cypress Park Estates ($1,871,500), Dundarave ($1,365,000), and Park Royal ($1,450,000) represent the most active pockets.
North Vancouver: More Activity, More Nuance
North Vancouver tells a more active story. The detached market is running at a 15 per cent sales ratio YTD 2026 — balanced to slightly favouring sellers in some pockets — with a median sale price of approximately $1,875,625 across 36 sales per month. Days on market average around 21 days, which is meaningfully faster than West Vancouver and reflects a deeper buyer pool at this price point.
North Vancouver Detached — Neighbourhood Snapshot (2025 Full Year)
Government Road stood out with a median of $2,746,000 (+17% year-over-year). Indian River reached $2,176,000 (+14%). Softer areas included Calverhall ($1,650,000, -13%), Pemberton Heights ($1,990,000, -25%), and Canyon Heights ($2,365,000, -1%). The spread between top and bottom performers is wide — hyper-local conditions matter enormously on the North Shore.
The North Vancouver attached market is healthier than West Van's, with a 17 per cent sales ratio in March 2026, approximately 121 sales per month, and a median around $886,250. Central Lonsdale ($840,000), Lower Lonsdale ($845,000), and Capilano ($1,109,500) are the most liquid segments. Days on market average 21 days — reasonable and consistent with a functioning market.
What This Means
The North Shore real estate market in spring 2026 is neither broken nor booming. It is a market defined by selectivity — buyers have more time and more choice than at any point since 2018, and sellers who price accurately are still transacting. Those who don't are sitting.
For investors and buyers watching this space: the detached segment in North Vancouver in particular is showing signs of stabilization, with sales volumes holding and days on market not deteriorating further. West Vancouver remains a patient buyer's market at the luxury end, with select neighbourhoods like British Properties and Altamont bucking the broader softness.
Frequently Asked Questions
Common questions about the North Shore market and what the current data means for buyers and sellers.
Is now a good time to buy on the North Shore?
Buyers currently have more time, more choice, and more negotiating room than at any point since 2018. The sales-to-active listings ratio on the North Shore is in balanced to buyer-friendly territory depending on property type. That said, well-priced properties in desirable pockets are still selling efficiently. If you have been waiting for conditions to improve, this spring represents a more level playing field than the market has offered in years.
Why are West Vancouver prices down but some neighbourhoods up?
West Vancouver is a market of micro-markets. The overall median has softened, but areas with limited inventory, exceptional views, or proximity to amenities — like the British Properties and Altamont — continue to hold or appreciate. The underperforming areas tend to be those with older product, less desirable configurations, or higher days on market historically. Price is always relative to location and product quality, and that relationship is more visible now than during the pandemic run-up when almost everything moved together.
What is a sales-to-active listings ratio and why does it matter?
The sales-to-active listings ratio measures what percentage of available homes are selling each month. A ratio below 12 per cent generally signals downward pressure on prices (buyer's market). Between 12 and 20 per cent is considered balanced. Above 20 per cent typically signals upward pressure on prices (seller's market). West Vancouver detached is currently at 5–6 per cent. North Vancouver detached is at approximately 15 per cent. These numbers tell you the relative negotiating position of buyers and sellers in each segment.
Are prices still falling on the North Shore?
The broad trend since the 2022 peak has been downward, but the pace of decline has slowed significantly. The March 2026 benchmark data shows prices essentially flat month-over-month across all property types. At the neighbourhood level on the North Shore, some pockets are still softening while others have stabilized or ticked up. The direction of prices going forward will depend heavily on mortgage rate movements, new listing volumes, and whether buyer confidence returns as we move through spring.
How does the Fraser Valley inventory surge affect the North Shore?
Indirectly rather than directly. Fraser Valley markets like Surrey, Langley, and Abbotsford are experiencing much more significant inventory buildups and buyer's market conditions than the North Shore. This matters because it shapes the broader narrative buyers bring to the table — they often assume conditions are equally soft everywhere. In reality, the North Shore's geographic constraints and distinct buyer profile mean it behaves differently. Buyers relocating from other markets may find less discounting available here than they expect.
What should sellers on the North Shore know right now?
Pricing strategy matters more in this market than it has in years. Well-priced, well-presented listings in liquid neighbourhoods are still moving within 21 days on average in North Vancouver. The listings that are sitting are almost universally priced above where comparable sales support them. Buyers in this market are informed and patient — and they have enough choice that overpriced listings are easy to ignore. The cost of sitting is real: every additional week on market signals to buyers that something is wrong with the product or the price.
Sources
- Greater Vancouver REALTORS® (GVR) — March 2026 Statistics Package and Press Release, April 2, 2026.
- SnapStats® Publishing Co. — 5-Year Trend Report 2026, Greater Vancouver Edition; YTD & Historic Statistics, March 2026, Greater Vancouver Edition.
- Andrew Lis, GVR Chief Economist — Quoted commentary from the March 2026 GVR press release.
A video breakdown of the North Shore spring market — what the numbers mean for buyers, sellers, and investors — is coming soon. Follow along at westvanliving.ca.
Debbie Evans | REALTOR®
eXp Realty | West Vancouver & North Shore Markets
The North Shore market rewards those who understand it at the neighbourhood level — not just the headline numbers. If you are thinking about buying, selling, or simply want to understand where things actually stand before making a move, I am here to give you a clear picture based on real data.
This content is for informational purposes only and does not constitute financial, legal, or investment advice. All data sourced from Greater Vancouver REALTORS® MLS® and SnapStats® Publishing Co. as of April 2026.
Categories
- All Blogs (82)
- aboriginal title ruling (2)
- bc housing market (22)
- bc real estate (49)
- Bill C-15 (1)
- build canada homes (8)
- Buyers Guide (4)
- canada strong fund (3)
- canadian real estate (9)
- Climate Change (2)
- Design & Build (4)
- Equity Growth (1)
- freehold (1)
- Home Buying Tips (1)
- housing policy (1)
- land claims (2)
- leasehold (1)
- local news (1)
- Lower Lonsdale (2)
- market insights (21)
- Multigenerational Living (2)
- North Vancouver Real Estate (15)
- open house (1)
- Open House Security (1)
- real estate insights (6)
- Squamish Market Update (5)
- squamish real estate (5)
- squamish update (1)
- Vancouver Real Estate (16)
- West Vancouver Living (11)
- West Vancouver Real Estate (21)
- Whistler Market Update (3)
Recent Posts


North Shore & Vancouver Realtor | License ID: 175378
+1(778) 875-4934 | debbie.evans@exprealty.com