
Canada At A Crossroads: A Business Assessment of Federal Spending, Housing, and Economic Announcements
This analysis evaluates public policy using standard business and financial due diligence principles. It does not assess political intent, party positions, or ideology — only the financial structure, risk, and execution of the decisions themselves.
Contents
This is a long-form analysis. Use the index below to navigate to the sections most relevant to you.
| Section | Topic |
|---|---|
| 01 | The Debt Reality |
| 02 | Canada Strong Fund Analysis |
| 03 | Leasehold Housing Model |
| 04 | Productivity & GDP |
| 05 | Immigration & Housing Gap |
| 06 | Tax Burden |
| 07 | Foreign Aid Spending |
| 08 | Asylum Costs |
| 09 | $90B Rail Project |
| 10 | Leadership & Governance |
| Summary | Final Assessment |
The Complete Picture at a Glance
The Debt Reality — Where Canada Stands Before Any New Spending
Before evaluating any new announcement, the starting financial position must be understood. In any business context, a lender reviewing a loan application begins with the applicant's current balance sheet. Here is Canada's.
| Metric | Amount | Source |
|---|---|---|
| Total federal debt | ~$1.4 trillion | Parliamentary Budget Office 2025–26 |
| Annual debt interest payments | ~$54 billion | Federal Budget 2025 |
| Current year deficit | ~$78 billion | Parliamentary Budget Office |
| Interest cost per Canadian annually | ~$1,400 | Statistics Canada population base |
| Canada Strong Fund new borrowing | $25 billion | PM Announcement April 27, 2026 |
| Additional annual interest on fund | ~$1.2–$1.5 billion | Government of Canada bond yield data |
The $54 billion annual interest payment alone exceeds total federal spending on the Canadian Armed Forces, the entire Employment Insurance program, and most years of federal infrastructure spending. Canada is paying $54 billion per year and receiving nothing in return — no roads, no hospitals, no housing, no services. Just the cost of carrying debt that already exists.
The Debt Cycle — Explained Simply
The government spends more than it collects in taxes. The difference becomes the annual deficit — currently $78 billion. To fund the deficit it borrows money by issuing bonds. The borrowed money must be repaid with interest — currently $54 billion per year. To pay interest, it either raises taxes, cuts spending, or borrows more. The new $25 billion Canada Strong Fund adds to the debt immediately. Interest begins accruing before a single return is generated. If the fund underperforms, the taxpayer absorbs both the interest cost and the investment loss. There is no automatic correction mechanism.
Institutional Assessment — Current Financial Position
Based on available data, the current fiscal position reflects a significant and growing annual operating deficit, with debt service costs consuming an increasing share of total revenue. Per-unit productivity metrics are declining. Under standard lending criteria, this profile would typically require a demonstrated path to surplus and clear debt reduction targets before additional capital deployment would be considered.
Q: Is Canada's debt level dangerous?
Canada's debt to GDP ratio is lower than the United States and Japan but has grown significantly since 2020. The concern is not the absolute level but the rate of growth, the rising cost of servicing that debt, and the structural deficit that shows no credible path to resolution. Source: IMF Fiscal Monitor 2025.
Q: What happens if the Canada Strong Fund's investments fail?
The borrowed $25 billion plus accumulated interest remains on the public balance sheet regardless of investment performance. Taxpayers absorb the downside. Unlike a private equity fund where investors lose their capital, here the capital is public debt. Source: Parliamentary Budget Office framework.
The Canada Strong Fund — A Business Due Diligence Assessment
On April 27, 2026, the Prime Minister announced a $25 billion national sovereign wealth fund — the Canada Strong Fund — to invest in energy corridors, ports, critical minerals, AI infrastructure, and clean energy. It will be structured as an independent Crown Corporation. Source: Prime Minister's Office press release, April 27, 2026.
The Standard Business Due Diligence Checklist
To access $25 billion from any private lender or institutional board, the following documentation would typically be required before a dollar was committed. Here is what has been made available publicly as of April 27, 2026.
| Requirement | What Was Provided | Due Diligence Assessment |
|---|---|---|
| Detailed business plan | Not published | Requires further documentation |
| Projected returns with timelines | Not published | Requires further validation |
| Risk assessment and downside scenarios | Not published | Does not currently demonstrate |
| Conflict of interest disclosure | Partial — blind trust in place | Requires independent verification |
| Governance structure | Announced but not yet operational | Pending — incomplete at announcement |
| Accountability metrics | Not defined | Requires further clarification |
| Capital source and cost of capital | Borrowed at ~5% before any return | Introduces elevated risk profile |
| Exit strategy | Not defined | Requires further documentation |
| Independent viability assessment | Not conducted | Would typically require before proceeding |
| Board or stakeholder approval | No independent check at announcement | Differs from standard institutional practice |
Institutional Assessment — Canada Strong Fund
As currently structured and based on publicly available information, the Canada Strong Fund does not yet demonstrate the documentation typically required in an institutional review process. Key items — including projected returns, risk assessment, conflict of interest resolution, and governance framework — would require further validation before proceeding under standard financial due diligence criteria.
The Brookfield Overlap
Mark Carney served as Chair of Brookfield Asset Management from 2020 to 2024. Brookfield manages over $900 billion in assets globally. Every sector targeted by the Canada Strong Fund is a sector where Brookfield currently operates at significant scale. Source: Brookfield Asset Management Annual Report 2024.
| Fund Sector | Brookfield Activity | Source |
|---|---|---|
| Clean energy | Acquired Boralex — wind, solar, hydro portfolio | Brookfield Renewable Partners filings 2024 |
| Critical minerals | Clarios batteries, Westinghouse nuclear | Brookfield public filings |
| Infrastructure | Inter Pipeline, global ports and highways | Brookfield Infrastructure Partners |
| Data and AI | CyrusOne data centers — 10 acquired 2025 | CyrusOne press release October 2025 |
| Agriculture | Oak Tree Capital AG investments | Oak Tree Capital management commentary 2024 |
Carney holds approximately $13 million in Brookfield shares, currently in a blind trust. Parliament has called for full divestment. No divestment has been confirmed. Source: Parliamentary ethics disclosures, Globe and Mail 2025.
Governance and Disclosure Standard
A blind trust arrangement means the holder cannot direct investments but retains the underlying financial interest. From a due diligence perspective, this raises a question of governance standard: whether the current disclosure arrangement meets the level of transparency typically expected when a decision-maker has prior financial connections to sectors targeted by a major public investment program. This is a structural governance observation, not an assessment of intent. The appropriate resolution — full divestment, enhanced disclosure, or independent oversight — is a matter for regulatory and parliamentary determination. Source: Conflict of Interest Act Canada; Office of the Ethics Commissioner.
The Asset Recycling Concern
Carney confirmed the fund will grow through "asset recycling" — meaning existing public assets may be sold or leased to generate capital for the fund. Under a 99-year lease structure, a private operator pays an upfront lump sum, manages the asset for nearly a century collecting all revenues, and generates 10 to 50 times their initial investment over the lease period. The public asset is effectively privatized for a century.
Real World Example — Brookfield's Peru Highway
Brookfield purchased highway concessions in Peru, raised tolls significantly, and faced protest blockades and a $2.7 billion legal dispute. Residents earning average monthly incomes of approximately $300 found toll rates unaffordable. The rates, adjusted annually, were considered the highest in the country for urban sections. Source: Reuters, Lima highway concession dispute reporting 2023–2024.
The Alberta Heritage Fund Warning
| Metric | Alberta Heritage Fund | Norway Government Fund |
|---|---|---|
| Established | 1976 | 1990 |
| Funded by | Oil surplus | Oil surplus |
| Current value | ~$22 billion | Over $1.7 trillion |
| Estimated value if managed like Norway | $500 billion+ | $1.7 trillion |
| Government withdrawals to balance budgets | Repeated — discipline broke down | Prohibited by law |
As currently structured, the Canada Strong Fund is being launched with borrowed money rather than surplus revenue and without a published governance framework. Canada's own Alberta Heritage Fund provides a domestic reference point for the governance discipline required to sustain a sovereign fund over time.
International Comparison — Norway Model vs Proposed Canadian Model
Norway's sovereign wealth fund is frequently cited as a global benchmark. It was built from surplus resource revenue and operates under strict governance rules that limit withdrawals and prioritize long-term returns. The proposed Canadian model differs in a key structural way: it is being funded through borrowing rather than surplus. This structural difference affects cost of capital, risk exposure, and long-term financial outcomes.
| Factor | Norway Model | Proposed Canadian Model |
|---|---|---|
| Funding source | Surplus resource revenue | Borrowed capital |
| Cost of capital | None — no debt obligation | Interest-bearing at current bond rates |
| Withdrawal rules | Strict — defined by law | Not yet defined publicly |
| Risk exposure | Low — no underlying debt | Higher — debt-backed, interest accrues before returns |
| Governance framework | Established and published | Announced but not yet operational |
| Current fund value | Over $1.7 trillion | $25 billion initial endowment |
This comparison is not a judgment on the Canada Strong Fund's potential outcomes. It is a structural observation about the different risk and cost profiles created by the choice of funding mechanism. A debt-funded sovereign vehicle must generate returns exceeding its borrowing cost before delivering any net benefit to taxpayers — a requirement that does not apply to a surplus-funded model.
Q: Are sovereign wealth funds a sound policy tool?
Yes, when structured appropriately. Norway's Government Pension Fund Global — built on surplus revenues with strict governance and withdrawal limits — has grown to over $1.7 trillion and is widely regarded as a model of sound institutional design. The key structural question for any sovereign fund is whether the funding source, governance framework, and return requirements align with long-term public benefit. A debt-funded model introduces a cost-of-capital requirement absent from surplus-funded models. Source: Norges Bank Investment Management Annual Report 2024.
Q: Could Canadians make money investing in this fund?
Possible but not guaranteed. Unlike a government bond with a guaranteed return, an equity fund carries market risk. If investments underperform, retail investors could see reduced or no returns. The government has indicated Canadians will be able to invest in the fund similarly to buying a Canada Savings Bond — but the risk profile is fundamentally different. Source: Federal government press conference, April 27, 2026.
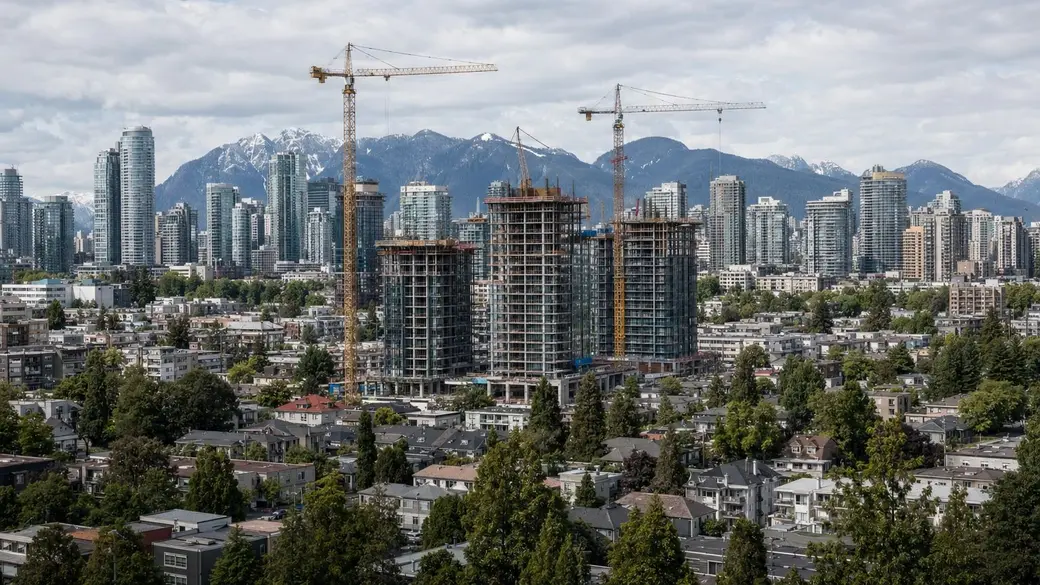
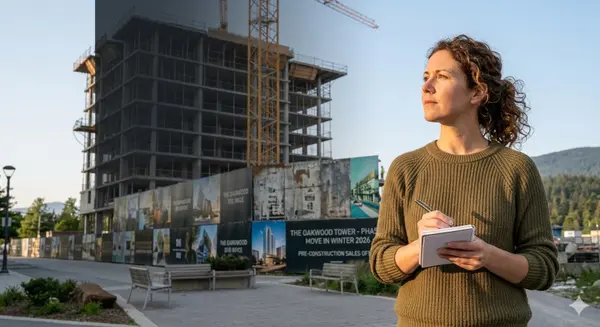
Canada Builds — A Market Assessment of the Leasehold Housing Model
Canada Builds proposes housing on federal Crown land using a leasehold structure: buyers own the unit but the government retains the land. It is positioned as approximately 20 percent cheaper than equivalent freehold ownership. Source: Federal housing policy announcements 2025–2026, CMHC leasehold guidance.
The Core Math
| Scenario | Price | Land Ownership | Long Term Equity |
|---|---|---|---|
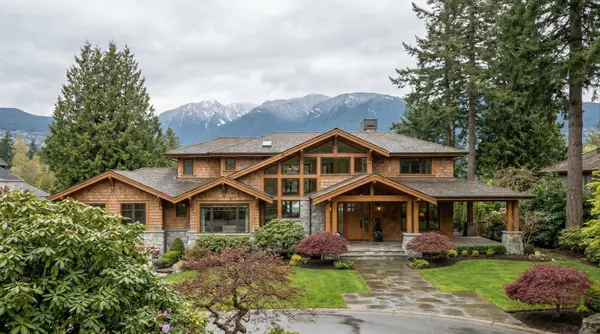
| Freehold home — Vancouver | $1,000,000 | Buyer owns land | Full appreciation |
| Leasehold equivalent | $800,000 | Government retains | Structure only |
| Stated saving | $200,000 | None transferred to buyer | Significantly limited |
Is $800,000 Affordable in Vancouver?
| Requirement | Amount | Source |
|---|---|---|
| Minimum down payment at this price point | $160,000 | CMHC mortgage rules |
| Annual household income required to qualify | ~$180,000–$200,000 | Standard debt service ratio guidelines |
| Median household income — Vancouver | ~$90,000–$100,000 | Statistics Canada Census 2021 |
| Monthly carrying cost estimate | $4,200–$4,800 | Current rates + strata + lease payment |
The Affordability Gap
The median Vancouver household does not qualify for this mortgage. A 20 percent saving on a $1,000,000 home does not create affordable housing. It creates an $800,000 leasehold property that remains out of reach for the majority of Vancouver households — while also being a structurally different and more restricted asset class than the freehold ownership it is intended to replace.
Who Collects What — The Wealth Transfer Question
| Party | What They Receive |
|---|---|
| Buyer | Use of land, ownership of structure only |
| Government landowner | Lease payments, all land value, all land appreciation |
| Buyer at sale | Value of structure only — subject to remaining lease term |
| Government at lease end | Full asset returned if lease not renewed |
The government collects lease income for the entire duration of the arrangement. The buyer builds no land equity. All land value growth flows to the landowner, not the buyer. This is a fundamentally different wealth-building outcome than freehold ownership — and it is the outcome being presented as an affordable housing solution.
Where Is the Crown Land in Vancouver?
| Federal Asset | Current Use | Available for Housing |
|---|---|---|
| Vancouver International Airport | Active airport | Not available |
| Port of Vancouver | Critical national infrastructure | Not available |
| CFB Esquimalt | Active military base | Not available |
| DND properties | Active defence use | Very limited |
| Rail corridors CN and CP | Active freight | Not available |
| Parks Canada holdings | Protected land | Not available |
| Coast Guard facilities | Active operations | Not available |
There is no large supply of readily available Crown land in Vancouver for housing. The most cited example — the Jericho Lands — is a multi-decade, multi-partner, extremely complex project that cannot be replicated because no equivalent land exists in the city.
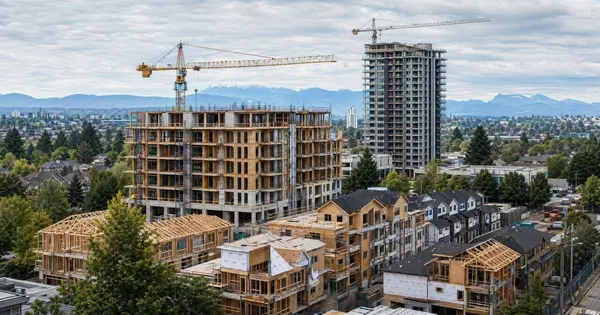
The Construction Cost Reality
| Cost Factor | Vancouver Reality | Source |
|---|---|---|
| Mid-rise construction cost per square foot | $400–$600 | BC Construction Association 2025 |
| Cost to build 700 sq ft unit before land | $280,000–$420,000 | Based on above |
| Development cost charges | Among highest in Canada | Urban Development Institute BC |
| Permitting timeline | Among longest in Canada | City of Vancouver data |
| Total cost before land | $350,000–$500,000+ | Industry estimates |
After construction costs, development charges, permitting, financing, and overhead — before any land cost — a modest unit in Vancouver already approaches or exceeds what most median income households can afford. The 20 percent leasehold saving on the land component does not solve this problem. And no builder, timeline, or procurement process has been identified in any government announcement.
Q: Has leasehold housing worked anywhere in Canada?
Leasehold housing exists across Canada, particularly in BC on First Nations land. It functions as a housing option but consistently trades at a discount to comparable freehold properties and carries documented financing and resale challenges as leases age. In Whistler, where I have worked for many years, these dynamics are not theoretical — they are daily market reality. Source: CMHC housing research, BC Real Estate Association data.
Q: What happens to financing as the lease ages?
As remaining lease terms shorten, lender pools shrink, down payment requirements increase, and CMHC eligibility conditions tighten. The critical question for any buyer is not whether you can get a mortgage today. It is whether the next buyer will be able to get a mortgage when you need to sell. If the answer becomes no, your exit strategy disappears with it. Source: CMHC leasehold mortgage insurance guidelines, major Canadian bank lending policies.
Productivity and Per Capita Wealth — The Foundation These Announcements Are Being Built On
Canada's labour productivity ranks second lowest in the G7. Labour productivity determines wages, living standards, and the capacity of businesses to invest and expand. Source: OECD Economic Outlook, Statistics Canada Productivity Accounts 2024.
Canada's GDP per capita declined 1.7 percent in 2023 — among the weakest performance in the G7. While total GDP grew, population growth divided that output among more people. The average Canadian's share of economic output is shrinking, not growing. Source: Statistics Canada National Accounts, IMF World Economic Outlook 2024.
Q: Why is Canada's productivity so low compared to other G7 nations?
Multiple factors: lower business investment in technology, higher regulatory burden, less competition in key sectors, housing costs that reduce labour mobility, and underinvestment in research and development. Source: OECD Canada Economic Survey 2024, Business Council of Canada productivity research.
Immigration, Housing, and Livability — The Missing Link
| Immigration Metric | Number | Source |
|---|---|---|
| Permanent residents admitted 2023 | 465,000 | IRCC Annual Report 2023 |
| Temporary residents active | Over 2 million | IRCC 2024 |
| Total population growth 2023 | ~1.2 million | Statistics Canada |
| New housing starts 2023 | ~240,000 | CMHC |
| International students 2023 | Over 900,000 | IRCC |
Canada added approximately 1.2 million people in 2023 and built approximately 240,000 new housing units. At 2.5 people per household, that represents roughly 480,000 units of capacity against 1.2 million new residents. The structural shortfall is not a future problem. It is happening now and compounding annually.
The Livability Decline
| Livability Metric | Current Status | Source |
|---|---|---|
| Housing affordability | Worst in G7 relative to income | OECD Housing Policy Brief 2024 |
| Rent as percentage of median income | 40–60% in major cities | CMHC Rental Market Report 2024 |
| Homelessness | Rising in all major cities | Canadian Observatory on Homelessness 2024 |
| Food bank visits | Record 2 million per month | Food Banks Canada HungerCount 2023 |
| Canadians without a family doctor | Over 6 million | Canadian Medical Association |
| Canadian emigration to United States | Rising trend | Statistics Canada |
The Emigration Signal
When a country's own citizens begin leaving at increasing rates it is a livability signal that goes beyond any single policy. Canadians are leaving primarily for lower cost of living, higher after-tax wages, more affordable housing, and better near-term economic opportunity in US states. Canada is simultaneously bringing in large numbers of new residents while losing established skilled workers and taxpayers. The net population number looks healthy. The composition of that change has significant long-term economic implications. Source: Statistics Canada emigration estimates, Royal Bank of Canada emigration research 2024.
The Tax Burden — What Canadians Pay vs What They Receive
| Tax Metric | Canada Reality | Source |
|---|---|---|
| Federal marginal top rate | 33% | CRA |
| Combined federal + provincial top rate — BC and Ontario | 53.5% | KPMG Tax Tables 2024 |
| Carbon tax annual household impact | $700–$1,500 net | Parliamentary Budget Office |
| Tax freedom day | ~June 14 | Fraser Institute |
Canadians work until approximately June 14 every year before a single dollar of income belongs to them. They pay among the highest combined tax rates in the G7 while experiencing declining per capita GDP, a housing crisis, record food bank usage, healthcare system strain, and now being asked to fund a $25 billion sovereign wealth fund with borrowed money.
Q: What do Canadians receive for that tax burden?
Healthcare access is strained — over 6 million Canadians have no family doctor. Housing is in national crisis with record homelessness. Infrastructure faces a $150 billion deferred maintenance backlog. Public transit is underfunded in most cities. The gap between what Canadians pay in taxes and what they receive in services has widened measurably over the past five years. Source: Canadian Medical Association, Federation of Canadian Municipalities, CMHC.
Foreign Aid and International Spending — What Canada Sends Abroad
| Item | Amount | Source |
|---|---|---|
| Total international assistance 2023–24 | $8.5 billion | Global Affairs Canada 2024 |
| Official Development Assistance | $7.1 billion | OECD DAC Canada Report 2024 |
| International climate finance pledged | $5.3 billion | Environment and Climate Change Canada |
| Ukraine aid committed since 2022 | Over $13 billion | Global Affairs Canada |
| UN and multilateral contributions | Over $1 billion annually | Global Affairs Canada |
| NATO spending gap — annual | ~$14–$16 billion | Parliamentary Budget Office estimate |
The Money That Does Not Come Back
The overwhelming majority of Canada's $8.5 billion in annual international assistance is non-recoverable. It is expenditure, not investment. It is funded by a government running a $78 billion deficit. Every dollar of foreign aid in a deficit year is a borrowed dollar that adds to the $1.4 trillion debt and generates zero direct financial return. This is not an argument that foreign aid has no value. It is an argument that in a deficit, every expenditure competes with every other expenditure — and that trade-off deserves honest accounting.
Q: Is the Ukraine aid recoverable?
Some is structured as loans through Export Development Canada and is theoretically recoverable. The grant portions are non-recoverable. The loan recovery timeline and likelihood are uncertain given the ongoing conflict. Source: Export Development Canada program documentation.
The Cost of Irregular Migration and Asylum Seekers — What Canadians Have Actually Paid
| Item | Cost | Period | Source |
|---|---|---|---|
| Federal hotel and accommodation for asylum seekers | Over $1 billion | 2017–2023 | IRCC ATI releases |
| Federal interim housing assistance program | Over $500 million | 2021–2024 | Parliamentary Budget Office |
| Daily hotel cost per person contracted | $100–$200 per night | Various | Blacklock's Reporter, ATI releases |
| Annual healthcare — Interim Federal Health Program 2022–23 | Over $200 million | Annual | Health Canada |
| Annual healthcare — IFHP 2023–24 | Over $350 million and rising | Annual | Parliamentary estimates |
| IRB annual budget | Over $350 million | Annual | Treasury Board |
| Legal aid for refugee claimants | Over $100 million annually | Annual | Department of Justice |
| Current claim backlog | Over 230,000 claims | 2024 | Immigration and Refugee Board |
The Coverage Comparison
The Interim Federal Health Program provides dental, vision, and prescription drug coverage to asylum seekers from day one of their claim. Many Canadian citizens and permanent residents do not have equivalent coverage. The federal dental care program for Canadian citizens was phased in slowly by income level and age. The perception of inequity is real and the frustration is legitimate — even if the policy rationale for each program is distinct. Source: IRCC IFHP program guidelines, Health Canada.
Q: Are irregular border crossers breaking the law?
Under Canadian and international law, a person who crosses the border irregularly and immediately claims asylum is exercising a legal right under the Refugee Convention. The entry method is irregular but the claim process is legal. Source: Immigration and Refugee Protection Act Canada, UN Refugee Convention.
Q: What is the total cost over the past decade?
A comprehensive total is not publicly available in a single document. Combining hotel costs, healthcare, legal aid, social services, and administrative costs across all levels of government, the total expenditure related to asylum seekers and irregular migration over the past decade is likely in the range of $10 to $20 billion or more. This figure requires independent audit to confirm precisely. Source: Derived from multiple departmental reports and access to information releases.
The $90 Billion Rail Project — When Government Infrastructure Has Already Failed Once
| Metric | Number | Source |
|---|---|---|
| Current HFR cost estimate | $80–$90 billion | Transport Canada HFR business case |
| Original scoping estimate | $12 billion | Earlier Transport Canada documents |
| PBO assessment | Significantly undercosted | Parliamentary Budget Office 2024 |
| Timeline to completion | 2040s at earliest | Transport Canada |
| Via Rail annual subsidy | ~$500 million/year | Transport Canada |
| Via Rail years without financial self-sufficiency | Nearly 50 years | Parliamentary accounts |
The Cost Escalation Pattern — Canadian Infrastructure
| Project | Original Estimate | Final Cost | Escalation |
|---|---|---|---|
| Montreal Champlain Bridge | $3.6 billion | $4.3 billion | 19% over |
| Eglinton Crosstown Toronto | $5.3 billion | Over $12 billion | 126% over |
| Vancouver Broadway Subway | $2.83 billion | $4 billion+ | 40%+ over |
| Site C Dam BC | $8.8 billion | $16 billion | 82% over |
| Trans Mountain Pipeline | $7.4B construction estimate | $34 billion total | 650% over construction estimate |
Trans Mountain — The Most Recent Federal Infrastructure Example
The federal government bought Trans Mountain for $4.5 billion and spent $34 billion building it. The original construction estimate was $7.4 billion. Annual revenue is approximately $900 million to $1 billion — meaning it will take 35+ years to recover the total capital deployed, without accounting for the cost of borrowing that capital. This is the federal government's most recent major infrastructure investment. It is the template being applied to a $90 billion rail project. Source: Trans Mountain Corporation Annual Reports, Parliamentary Budget Office.
If HFR Follows the Documented Pattern
Conservative 50% overrun: $135 billion. Moderate 100% overrun: $180 billion. Trans Mountain equivalent escalation: $675 billion. These are not predictions. They are illustrations of what the documented Canadian infrastructure cost escalation pattern produces when applied to a $90 billion starting estimate.
Q: What is the private sector signal on HFR viability?
If the High Frequency Rail project were financially viable, the private sector would build it. Private investors assess projects on projected returns against capital cost and risk. No private consortium has proposed to build this project without significant government subsidy guarantees. That is the market's answer to the viability question. Source: Transport Canada HFR procurement history.
Governance Standards and Institutional Expectations
This section evaluates the current government's financial announcements against the governance and disclosure standards that institutional investors, central banks, and regulated financial bodies typically apply. The comparison is structural — it examines the standards themselves, not intent or motive.
The Prime Minister's professional background includes serving as Governor of the Bank of Canada, Governor of the Bank of England, and Chair of a major global asset management firm. Each of those roles carried specific governance expectations around disclosure, conflict of interest management, fiscal transparency, and accountability. Those same standards form the analytical basis of this section.
| Institutional Governance Standard | Current Status — As Publicly Available |
|---|---|
| Conflict of interest — full disclosure and divestment where required | Partial — blind trust in place; full divestment not confirmed |
| Published investment framework before capital deployment | Not published for Canada Strong Fund as of announcement date |
| Projected returns with defined timelines | Not made public as of announcement date |
| Fiscal targets with measurable reduction pathway | $78 billion deficit — reduction timeline not defined |
| Independent oversight structure operational before commitment | Crown Corporation structure announced but not yet operational |
| Full governance framework published before announcement | Key details indicated as forthcoming in Spring Economic Update |
Analytical Observation
From a due diligence perspective, the governance documentation typically expected before a major public investment commitment — published returns framework, conflict of interest resolution, operational oversight structure, and accountability metrics — was not available at the time of announcement. This differs from standard institutional financial practice, where governance frameworks are established before capital deployment rather than following it. This is a structural observation about process and sequencing, not an assessment of outcomes or intent.
Q: Does this analysis reflect a particular political position?
No. The governance standards applied in this section would be equally applicable to any government of any party announcing equivalent programs with equivalent levels of documentation. The analysis focuses on process, structure, and financial framework — not on the political identity of the decision-makers. The same due diligence questions would apply to any institutional proposal at this scale. Source: Basic public finance and corporate governance principles; Treasury Board of Canada guidelines on major Crown investments.
The Complete Business Assessment — What Has Not Been Answered
| Issue | Reality | Source |
|---|---|---|
| Federal debt | ~$1.4 trillion | PBO |
| Annual interest | ~$54 billion | Federal Budget 2025 |
| Annual deficit | ~$78 billion | PBO |
| Canada Strong Fund | $25 billion — borrowed | PM announcement April 27, 2026 |
| Labour productivity G7 rank | Second lowest | OECD 2024 |
| GDP per capita change 2023 | Negative 1.7% | Statistics Canada |
| Housing supply gap 2023 | ~720,000+ annually | CMHC, Statistics Canada |
| Leasehold price — Vancouver | ~$800,000 | Derived from policy announcements |
| Income needed to qualify | ~$180,000–$200,000 | Mortgage qualification standards |
| Median Vancouver income | ~$90,000–$100,000 | Statistics Canada Census 2021 |
| Annual foreign aid | $8.5 billion | Global Affairs Canada |
| Ukraine commitment total since 2022 | Over $13 billion | Global Affairs Canada |
| Hotel costs — asylum seekers documented | Over $1 billion | IRCC ATI releases |
| HFR rail estimate | $80–$90 billion | Transport Canada |
| Trans Mountain cost overrun | 650% from construction estimate | TMC 2024 |
| Canadians without family doctor | Over 6 million | CMA |
| Food bank visits monthly | 2 million | Food Banks Canada |
| Top combined tax rate BC and Ontario | 53.5% | KPMG 2024 |
Documentation and Clarity — Items Requiring Further Publication
| Item | Status as of April 2026 |
|---|---|
| Canada Strong Fund — business plan and investment framework | Not published |
| Projected investment returns and timelines | Not published |
| Conflict of interest resolution framework | Pending — partial disclosure in place |
| Canada Builds — builder identification and procurement process | Not announced |
| Crown land sites identified and assessed for housing | Not published |
| Construction timeline and delivery schedule | Not published |
| HFR — independent viability and cost assessment | Not published beyond PBO preliminary note |
| Irregular migration — total decade cost — independent audit | Not conducted |
| Productivity improvement strategy tied to investment framework | Not published |
| Federal debt — reduction timeline and pathway to surplus | Not defined publicly |
Analytical Summary and Closing Position
Sovereign wealth funds, infrastructure investment, immigration, and international assistance are each legitimate policy tools with documented benefits in appropriate contexts. This analysis does not argue against any of these as concepts. It evaluates the structural, financial, and procedural framework within which they are currently being implemented.
Based on available data and using standard financial due diligence principles, the programs reviewed in this document share a common characteristic: the documentation, planning, and governance frameworks typically required before capital deployment have not been made publicly available. This introduces structural risk that is independent of the merits of the underlying policy goals.
In business, money follows plans. Plans require documented assumptions. Documented assumptions require transparent reporting. And transparent reporting allows for course correction when outcomes diverge from projections. These are not political requirements. They are the operational standards of any accountable institution managing capital on behalf of others.
Every Canadian taxpayer has a financial interest in these decisions. Standard financial practice holds that those with a financial interest in a capital deployment decision are entitled to see the documentation that supports it — including projected returns, risk assessments, conflict of interest disclosures, and accountability metrics.
Constructive Framework — What Stronger Planning Looks Like
This analysis is intended to support informed discussion, not to assign blame or predict outcomes. The purpose is to identify where structure, planning, and execution could be strengthened. In any business environment, challenges of this scale are addressed through clearer planning, measurable targets, transparent reporting, and alignment between financial inputs and expected outcomes. The same principles apply here. Stronger documentation, published return projections, resolved governance questions, and a credible debt reduction pathway would each materially strengthen the public case for these investments — and reduce the financial risk borne by Canadian taxpayers if outcomes fall short of projections.
Frequently Asked Questions
Common questions about Canada's major economic and housing announcements — answered from an industry practitioner's perspective.
Under standard institutional criteria, would this funding profile proceed to review?
Based on available public information and using standard financial due diligence criteria, the combination of a significant existing debt load, an annual operating deficit, a proposed new investment without a published business plan, an unresolved governance question, a housing product that does not meet the income qualification threshold of its target demographic, and a major infrastructure project in a sector with a documented cost escalation history would typically require additional documentation and validation before proceeding to formal review. This is a structural observation, not a final determination.
What would a well-structured sovereign wealth fund look like for Canada?
From a due diligence perspective, a structurally sound sovereign fund would be funded by surplus revenue rather than borrowed capital, would have a published governance framework with legally defined withdrawal limits, would include projected returns and risk assessments before capital deployment, and would have independent oversight with defined accountability metrics. Norway's Government Pension Fund Global represents one documented model of this approach. The structural differences between that model and the proposed Canadian framework are outlined in the comparison table in Section 2. Source: Norges Bank Investment Management Annual Report 2024.
What structural changes would address the housing affordability gap identified in this analysis?
Based on available market data and 39 years of industry experience, closing the affordability gap in high-cost markets such as Vancouver requires supply at price points accessible to median income households using standard mortgage qualification criteria. As currently structured, the leasehold model at approximately $800,000 does not meet this threshold given a median household income of $90,000 to $100,000. Structural solutions would include freehold ownership pathways, coordinated development charge reform across all levels of government, permitting acceleration, and construction cost reduction initiatives. These represent structural observations, not prescriptions.
Does this analysis reflect an anti-immigration position?
No. The analysis reflects a planning coordination concern. Immigration at any level introduces demand for housing, healthcare, and service infrastructure. The structural question raised in Section 5 is whether that demand has been matched by coordinated supply-side planning across housing, healthcare, and infrastructure — not whether immigration as a policy is beneficial. Those are separate analytical questions.
What should readers do with this information?
This analysis is designed to support informed evaluation. Readers are encouraged to consult the primary sources cited throughout, review government announcements alongside the complete financial context, and apply the same due diligence standards to public capital decisions that they would apply to any other major financial commitment. Questions about specific financial or investment implications should be directed to a qualified financial or legal professional.
Sources
- Parliamentary Budget Office — Economic and Fiscal Outlook 2025–26; Trans Mountain costing analysis; carbon tax incidence analysis 2024; long-term fiscal sustainability report.
- Federal Budget 2025 — Finance Canada. Annual debt servicing costs and deficit projections.
- Prime Minister's Office — Canada Strong Fund press release and press conference, April 27, 2026.
- Brookfield Asset Management — Annual Report 2024; Brookfield Renewable Partners filings; Brookfield Infrastructure Partners annual report.
- Office of the Conflict of Interest and Ethics Commissioner, Canada — Conflict of Interest Act; ethics disclosures.
- CMHC — Spring 2026 Housing Supply Report; Housing Affordability Monitor; Rental Market Report 2024; leasehold mortgage insurance guidelines; BC market reports.
- Statistics Canada — Census 2021; National Accounts; Productivity Accounts 2024; emigration estimates; immigration data.
- OECD — Economic Outlook 2024; Compendium of Productivity Indicators 2024; Canada Economic Survey 2024; Housing Policy Brief 2024.
- IMF — Fiscal Monitor 2025; World Economic Outlook 2024; Article IV Consultation Canada 2024.
- Global Affairs Canada — International Assistance Report 2023–24; Ukraine response tracker; multilateral contributions report.
- IRCC — Annual Report 2023; access to information releases; international student permit cap announcement January 2024.
- Immigration and Refugee Board of Canada — Annual reports; backlog and processing time statistics 2024.
- Health Canada — Interim Federal Health Program program documentation and expenditure data.
- Transport Canada — High Frequency Rail environmental assessment and business case documents.
- Trans Mountain Corporation — Annual reports 2022–2024; project cost disclosures.
- Norges Bank Investment Management — Annual report 2024; Norway Government Pension Fund Global.
- NATO — Annual report 2024; member state defence spending data.
- Canadian Medical Association — Primary care access data 2024.
- Food Banks Canada — HungerCount 2023.
- KPMG — Canadian Individual Tax Rate Tables 2024.
- Fraser Institute — Canadian Tax Freedom Day 2024.
- BC Construction Association — Construction cost data 2025.
- Urban Development Institute BC — Development cost charge data and advocacy, 2024–2026.
- BC Real Estate Association — Leasehold advisories; market forecasts.
- Federation of Canadian Municipalities — Infrastructure gap report; emergency housing cost reports 2022–2023.
- Reuters — Lima, Peru highway concession dispute reporting, 2023–2024.
- Globe and Mail — Carney Brookfield holdings reporting, 2025.
- Blacklock's Reporter — Access to information releases on asylum seeker accommodation costs.
- Royal Bank of Canada — Canadian emigration research 2024.
This analysis is part of an ongoing series examining Canadian housing, economic policy, and public spending from a real estate and construction industry practitioner's perspective. Video discussions of each section are available on the channel. Subscribe to follow the series as additional data becomes available.
Debbie Evans | REALTOR® & Registered Interior Designer
eXp Realty | Vancouver, North Shore & Whistler Markets | 39 Years Industry Experience
This analysis draws on 39 years of direct experience in residential real estate, interior design, and construction across Vancouver, the North Shore, and Whistler — including significant work with international buyers and investors in complex leasehold and freehold markets. The questions raised in this document reflect the practical realities observed over four decades in the industry, applied to the policy decisions currently shaping the Canadian housing and economic landscape.
For specific questions about how current policy affects your property decisions, I am available to discuss the full picture.
This document is prepared for informational and professional discussion purposes only. It does not constitute financial, legal, investment, or political advice. All figures are sourced from publicly available government documents, Parliamentary Budget Office reports, CMHC publications, Statistics Canada, and recognized industry data current as of April 2026. Some figures are derived estimates based on available data and are noted as such throughout. This analysis evaluates financial structure and process using standard due diligence principles and does not represent the views of any political party or political organization. Readers are encouraged to consult primary sources independently and seek qualified professional advice before making financial or investment decisions.
Categories
- All Blogs (82)
- aboriginal title ruling (2)
- bc housing market (22)
- bc real estate (49)
- Bill C-15 (1)
- build canada homes (8)
- Buyers Guide (4)
- canada strong fund (3)
- canadian real estate (9)
- Climate Change (2)
- Design & Build (4)
- Equity Growth (1)
- freehold (1)
- Home Buying Tips (1)
- housing policy (1)
- land claims (2)
- leasehold (1)
- local news (1)
- Lower Lonsdale (2)
- market insights (21)
- Multigenerational Living (2)
- North Vancouver Real Estate (15)
- open house (1)
- Open House Security (1)
- real estate insights (6)
- Squamish Market Update (5)
- squamish real estate (5)
- squamish update (1)
- Vancouver Real Estate (16)
- West Vancouver Living (11)
- West Vancouver Real Estate (21)
- Whistler Market Update (3)
Recent Posts


North Shore & Vancouver Realtor | License ID: 175378
+1(778) 875-4934 | debbie.evans@exprealty.com